

Claude Code /insights Roasted My Workflow. Here's What I Fixed.
What /insights reveals about your workflow — and the CLAUDE.md rules I added because of it.

I ran one command last week. Typed `/insights` into Claude Code, waited a few minutes, and got back an interactive HTML report analyzing my last 30 days of sessions.
The stats were interesting. Messages sent, tools used, peak hours. Fine.
Then it got to the friction analysis. And it started quoting my own words back at me.
It knew where I was wasting time. It knew which mistakes I kept repeating. It knew the exact patterns causing most of my friction - and I hadn’t noticed any of them.
In my Opus 4.6 post:
Opus 4.6 Dropped. The Benchmarks Are the Least Interesting Part

A new model drops. The web explodes. Most people will read the benchmarks, nod, update their API calls, and move on. The missed 80% of other announcements, but not me, and I want you to know about them too.
I mentioned `/insights` briefly. I promised a deeper look. This is that post.
Here’s what the command does, what it found in my sessions, and - more importantly - the specific rules I added to prevent my top friction points from happening again.
How To Run Claude Code’s /insights Command
Type `/insights` in Claude Code. That’s it.

The command reads your last 30 days of session transcripts - your prompts and Claude’s responses - processes them to extract patterns, then generates an interactive HTML report saved to `~/.claude/usage-data/report.html`. It opens in your browser automatically with a simple double-click.
It analyzes session transcripts stored locally in `~/.claude/`, your prompts, Claude’s responses, tool usage, errors, and interaction patterns.
It doesn’t touch your actual code files. Your source code never gets uploaded. The command works with session transcripts only.
The report takes a few minutes to generate depending on how many sessions you have. Mine processed 38 sessions and 659 messages. The result is a single HTML page with styled charts, narrative analysis, and — the best part — specific, copy-paste-ready suggestions for improving your workflows.
What the Claude Code Insights Report Shows You
The report opens with an “At a Glance” box. Four sections: what’s working, what’s hindering you, quick wins to try, and ambitious workflows. Perfect executive summary. Skim this first, then dig into the details below.
The Stats Dashboard
Top-level numbers across your sessions. Mine looked like this:
- 659 messages across 38 sessions
- +25,806 / -8,079 lines changed
- 165 files touched
- 22 days active
- 30 messages per day average
Useful for a quick check. But the real value isn’t here.
Usage Charts
The report generates bar charts showing what you asked Claude to do most, which tools it used, what languages you worked in, and what types of sessions you ran.

My top tool was Edit at 523 uses. My top request type was content revision at 14 instances. Again, just a useful snapshot for how I operate.
How You Use Claude Code
This is where the report gets personal and insightful. It generates a narrative analysis of your working style — not just numbers, but a paragraph describing how you work.
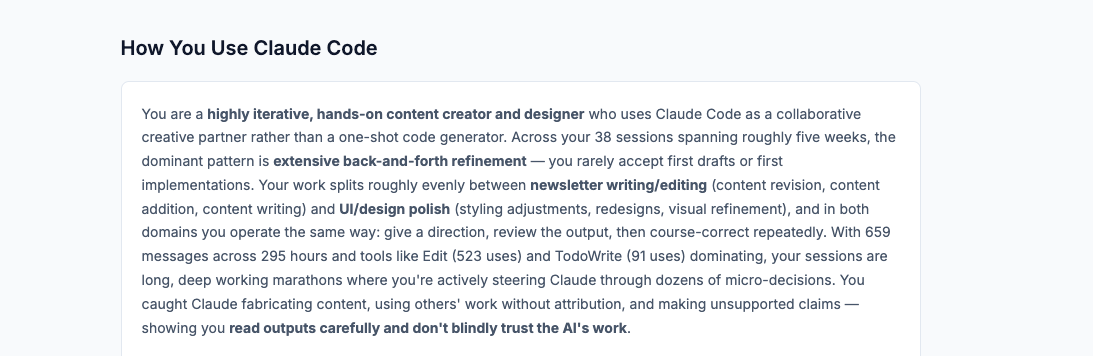
The narrative also identified that my satisfaction skewed positive despite the friction - meaning I expect iteration as part of the process rather than viewing it as a failure. That’s an insight I wouldn’t have articulated about myself.
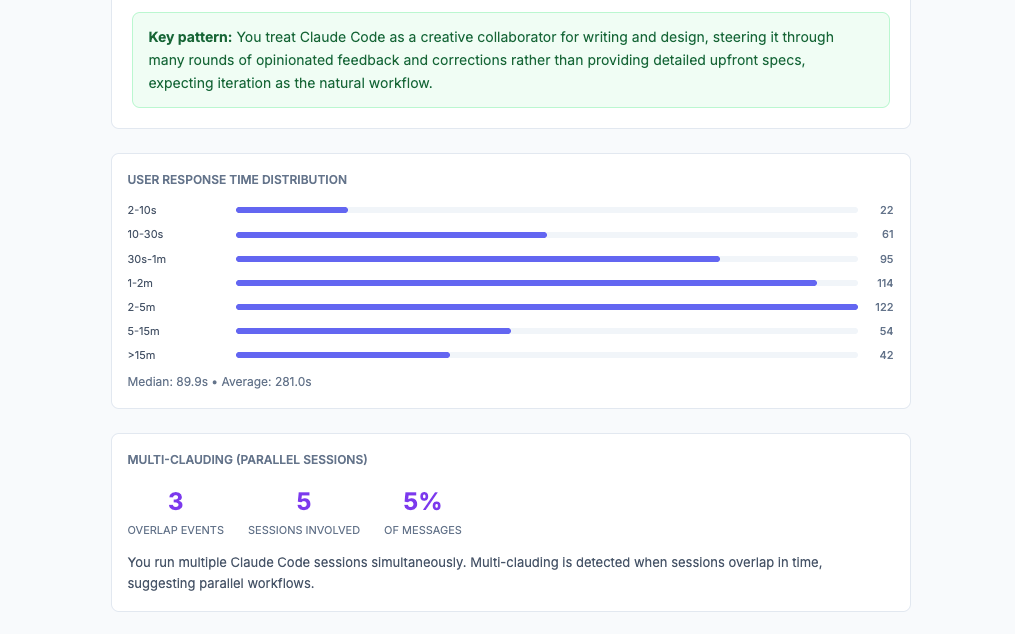
Time Of Day And Session Patterns
The report tracks when you’re most active and whether you run multiple Claude sessions in parallel.
The timezone selector is a nice touch — you can switch between PT, ET, London, CET, Tokyo, or a custom offset to see your patterns in your local time.
Claude Code Friction Analysis: Where Your Workflow Breaks Down
The friction section is where you have to spend the most time on.
The report categorizes every point of friction across your sessions, ranks them by frequency, and gives specific examples pulled from your actual conversations. It’s like a retrospective you didn’t have to write.
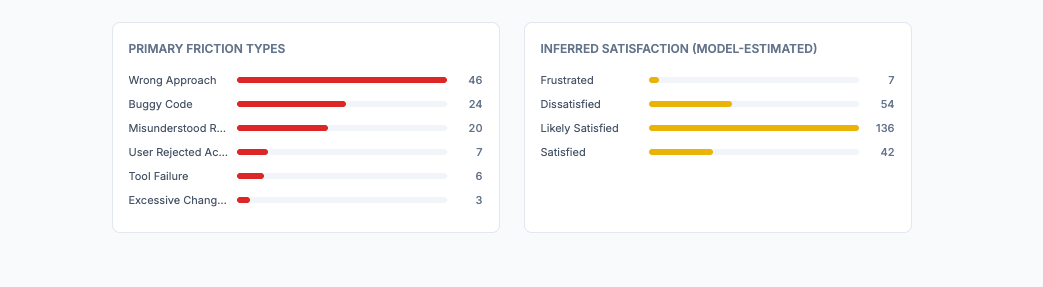
My Top Two Friction Categories
1. Wrong Approach and Premature Action
46 instances. By far my biggest pain point. Claude repeatedly jumped into implementation without understanding what I actually wanted. I would blame completely myself here, because my guess is that I didn’t explain myself in clear enough terms so that Claude would know what I was after. Also, sometimes I got into this weird loop, where Claude would do something crazy and I would sit there and think: “Am I talking to Sonnet v2 or something?”, so the number could be a bit skewed, maybe. But in terms of my prompting, here’s what the report said:
The fix the report suggested: front-load explicit instructions about approach before giving the go-ahead. Or use plan mode to force a proposal step before execution.
2. Visual and Design Iteration Struggles
Claude consistently misjudged my visual preferences. Wrong spacing. Icons that didn’t match the design system or were not aligned. Effects I explicitly rejected. Each one triggered its own correction cycle. The report suggested providing visual references and design constraints upfront to cut the back-and-forth.
CLAUDE.md Rules That Fix Your Top Claude Code Friction
Here’s where `/insights` goes from diagnostic to prescriptive, and I love this part. The report generates specific CLAUDE.md additions — rules you can copy directly into your Claude Code configuration — tailored to the exact friction patterns it found.
